
| Market Cap | ₹708.18 CrSmall Cap |
|---|---|
| P/E Ratio | 23.89Sector PE 46.45 |
| RSI | 44.56Neutral Zone |
| 1Yr Return | 37.14%Price Performance |
| Metric | Q2-27 | Q1-27 | Q2-26 |
|---|---|---|---|
| Revenue from Operations | 140 | 139 | 116 |
| Other Income | 1.3 | 0.9 | 4.3 |
| Total Income | 141 | 140 | 120 |
| Profit Before Tax | 16.1 | 13.5 | 8.4 |
| Net Profit | 12.8 | 10.3 | 6.8 |
| Operating Margin | 11.4% | 9.7% | 7.0% |
| Net Profit QoQ | +24.3% | ||
| Net Profit YoY | +88.2% | ||
| Adj. Profit QoQ | +17.5% | ||
| Adj. Profit YoY | +261.0% | ||
Key highlights
- Net profit surged to ₹12.8 crore, up 88.2% from ₹6.8 crore in the same quarter last year
- Revenue from operations grew 20.7% year-on-year to reach ₹140 crore
- Operating margins expanded to 11.4% from 7.0% in Q2 FY26
- Sequential net profit growth stood at 24.3% compared to ₹10.3 crore in Q1 FY27
- Promoter holding remains stable at 59.14% with no pledged shares
Operational Performance and Profitability Surge
Haldyn Glass delivered a strong financial performance in Q2 FY27, with revenue from operations rising to ₹140 crore. The 20.7% year-on-year revenue growth combined with improved cost efficiencies led to a substantial bottom-line boost, as net profit reached ₹12.8 crore. This growth is particularly notable as it comes despite a significant decrease in other income, which fell to ₹1.3 crore from ₹4.3 crore in the year-ago period.
The company's focus on operational excellence is reflected in its expanded operating margin of 11.4%, a sharp increase from the 7.0% recorded in the same quarter last year.
Key Financial Metrics for Q2 FY27
- Revenue from operations grew to ₹140 crore against ₹116 crore in Q2-26
- Total income stood at ₹141 crore, up from ₹120 crore year-on-year
- Profit before tax reached ₹16.1 crore, marking a 91.7% increase from ₹8.4 crore in Q2-26
- Operating margin improved sequentially from 9.7% in Q1-27 to 11.4%
- The company maintains a healthy Piotroski Score of 7, indicating robust financial strength
Capacity Expansion and Modernisation Roadmap
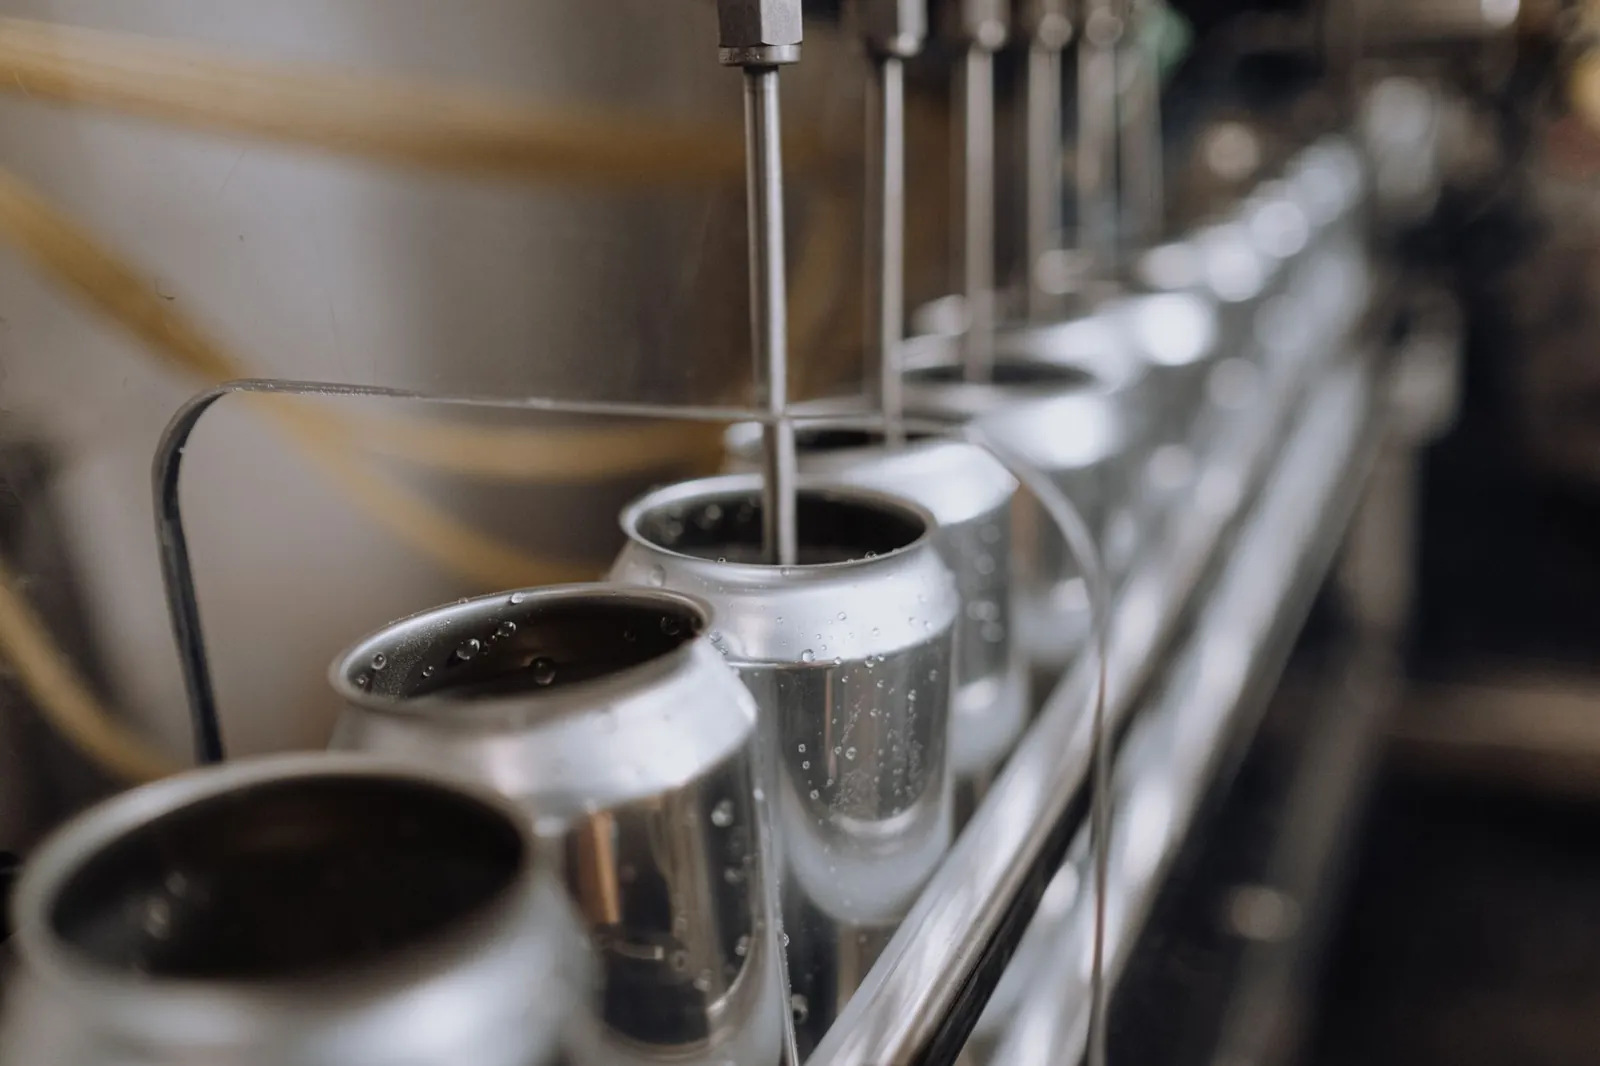
Following a board approval on August 03, 2026, Haldyn Glass is moving forward with a ₹150 crore capital expenditure plan. This investment is aimed at rebuilding, modernising, and expanding the company's glass manufacturing capacity by approximately 75 tonnes per day over a 12-month period. This strategic move is expected to enhance production capabilities and drive future revenue growth.
Furthermore, the company's associate, Haldyn Heinz Fine Glass, recently committed to acquiring a stake in Jamnagar Renewables Two Private Limited to secure renewable power, aligning with long-term sustainability goals.
| Date | Announcement | Amount |
|---|---|---|
| 03 Aug 2026 | Q1 FY27 standalone net profitSource: BSE filing | ₹9.24 Cr |
| 03 Aug 2026 | Capacity expansion and modernisation capex guidanceSource: multibagg.ai | ₹150.00 Cr |
| 21 May 2026 | Q4 FY26 standalone net profitSource: BSE filing | ₹5.26 Cr |
| 13 Feb 2026 | Q3 FY26 standalone net profitSource: BSE filing | ₹4.61 Cr |
| 11 Nov 2025 | Q2 FY26 standalone net profitSource: BSE filing | ₹4.44 Cr |
| 14 Aug 2025 | Q1 FY26 standalone net profitSource: BSE filing | ₹4.02 Cr |
What to watch next
- Completion of the ₹150 crore manufacturing capacity expansion by August 2027
- Operationalisation of 75 tonnes per day additional glass manufacturing capacity
- Impact of renewable energy integration through the associate's investment in Jamnagar Renewables
| Share price | ₹131.75 |
|---|---|
| Market capitalisation | ₹708.18 Cr |
| Revenue (annual) | ₹463.67 Cr |
| Net profit (annual) | ₹24.77 Cr |
| Revenue (latest quarter) | ₹138.69 Cr+28.13% vs previous quarter |
| Net profit (latest quarter) | ₹10.26 Cr+40.36% vs previous quarter |
| P/E (TTM) | 23.89×Sector 46.45× |
| Promoter holding | 59.14%0.00% QoQ |
| FII holding | 0.09%Current quarter |
Reference market data from a third-party provider, as of the story. Not a valuation or a recommendation.
Exchange filing by Haldyn Glass Ltd announcing the unaudited financial results for the quarter and half year ended September 30, 2026. Market figures from a third-party data provider.