
| P/E Ratio | 36.48Sector: 50.38 |
|---|---|
| Market Cap | ₹1,110.59 CrTextiles Sector |
| Promoter Holding | 57.35%Stable holding |
| RSI | 52.5Neutral Zone |
| Metric | Q2-27 | Q1-27 | Q2-26 |
|---|---|---|---|
| Revenue from Operations | 265 | 229 | 207 |
| Other Income | 3.2 | 5.7 | 0.2 |
| Total Income | 268 | 235 | 207 |
| Profit Before Tax | 21.0 | 13.4 | -6.7 |
| Net Profit | 15.5 | 9.6 | -5.2 |
| Operating Margin | 7.8% | 5.7% | -3.2% |
| Net Profit QoQ | +61.5% | ||
| Net Profit YoY | +398.1% | ||
| Adj. Profit QoQ | +131.2% | ||
| Adj. Profit YoY | +358.0% | ||
Key highlights
- Net profit stood at ₹15.5 crore in Q2 FY27, compared to a net loss of ₹5.2 crore in Q2 FY26
- Revenue from operations grew 28% year-on-year to reach ₹265 crore
- Operating margins recovered significantly to 7.8% from -3.2% in the same quarter last year
- Profit before tax for the quarter was recorded at ₹21.0 crore against a loss of ₹6.7 crore YoY
- H1 FY27 consolidated net profit reached ₹25.10 crore on a total income of ₹502.92 crore
Operational Turnaround and Revenue Growth
Faze Three demonstrated a strong recovery in the September 2026 quarter, reporting consolidated revenue of ₹265 crore compared to ₹207 crore in the prior year. This 28% year-on-year growth was accompanied by a sharp shift in profitability, with the company recording a profit before tax of ₹21.0 crore against a loss of ₹6.7 crore in Q2 FY26. Sequentially, performance improved as revenue rose from ₹229 crore in Q1 FY27.
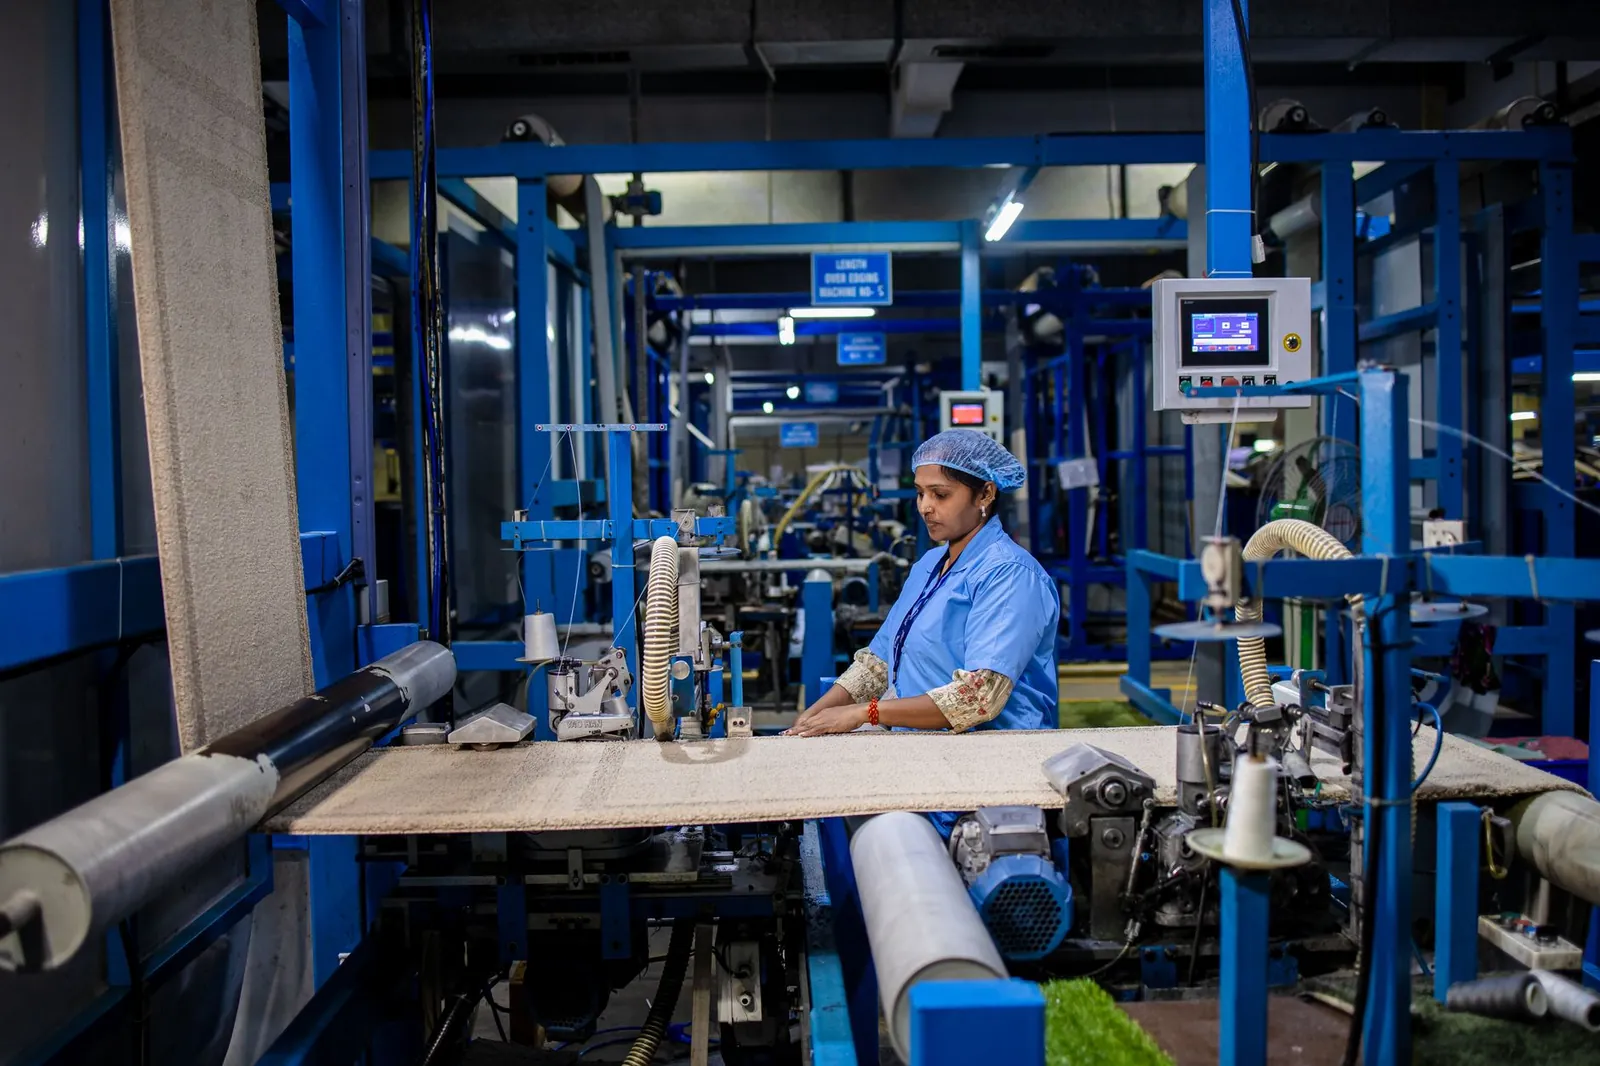
This trajectory aligns with management's earlier guidance of exceeding a 20% CAGR, supported by strong order book visibility for its core home textiles segment, which includes products like bathmats and rugs.
Asset Expansion and Strategic Capex
- Planned capital expenditure of ~₹75 crore for FY27 to conclude a major capacity expansion cycle
- Participation in the PLI Scheme for MMF Fabrics with a committed minimum investment of ₹100 crore
- Consolidated total assets increased to ₹952.32 crore from ₹818.99 crore in March 2026
- Inventory levels stood at ₹222.32 crore as of September 30, reflecting scaled-up operations
- Short-term borrowings rose to ₹335.08 crore to support working capital for the growing order book
- Cash and cash equivalents at the end of the half-year improved to ₹22.73 crore
Sector Context and Market Performance
In a period where the textile sector witnessed average net profit growth of 66.77%, Faze Three significantly outperformed with a 398.1% year-on-year surge in net profit. The recovery in operating margins to 7.8% highlights improved efficiency and cost management. At a current stock price of ₹451.5, the stock trades at a trailing P/E of 36.48, which remains below the industry average of 50.38.
Despite a 7.5% decline over the past year, recent quarterly momentum has triggered a 9.38% weekly price gain, positioning the company as a mid-range performer within the textiles and apparels sector.
| Date | Announcement | Amount |
|---|---|---|
| 11 Aug 2026 | Q1 FY27 consolidated revenue from operationsSource: icicidirect.com | ₹229.39 Cr |
| 12 Feb 2026 | Q3 FY26 consolidated total incomeSource: kotakneo.com | ₹229.33 Cr |
| 13 Nov 2025 | Q2 FY26 consolidated total incomeSource: kotakneo.com | ₹207.22 Cr |
| 12 Aug 2025 | Q1 FY26 consolidated revenue from operationsSource: icicidirect.com | ₹211.97 Cr |
| 23 May 2025 | Q4 FY25 consolidated total incomeSource: in.investing.com | ₹218.00 Cr |
What to watch next
- Execution of the ₹75 crore FY27 capex plan to enhance product capabilities
- Utilization of the ₹100 crore investment commitment under the PLI scheme for MMF fabrics
- Monitoring of raw material cost trends for cotton and synthetic fibers in H2 FY27
- Next quarterly financial results announcement scheduled for February 2027
| Share price | ₹451.5 |
|---|---|
| Market capitalisation | ₹1,110.59 Cr |
| Revenue (annual) | ₹923.07 Cr |
| Net profit (annual) | ₹33.57 Cr |
| Revenue (latest quarter) | ₹229.39 Cr-17.24% vs previous quarter |
| Net profit (latest quarter) | ₹9.64 Cr-50.82% vs previous quarter |
| P/E (TTM) | 36.48×Sector 50.38× |
| Promoter holding | 57.35%-0.66% QoQ |
| FII holding | 0.14%Current quarter |
Reference market data from a third-party provider, as of the story. Not a valuation or a recommendation.
Exchange filing by Faze Three Limited announcing its Un-Audited Standalone and Consolidated Financial Results for Q2 and H1 FY27. Market figures from a third-party data provider.