| FY26 Revenue | ₹3,067.1 Cr63% YoY Growth |
|---|---|
| Market Cap | ₹8,607.3 CrRetailing Sector |
| ROE Annual | 20.8%High Efficiency |
| PEG TTM | 0.49Price/Earnings to Growth |
Key highlights
- FY26 Revenue reached ₹3,067.1 Cr, representing a 63% year-on-year growth compared to FY25.
- Net Profit for the full year surged by 125% to ₹162.1 Cr, up from ₹72.03 Cr in the previous fiscal.
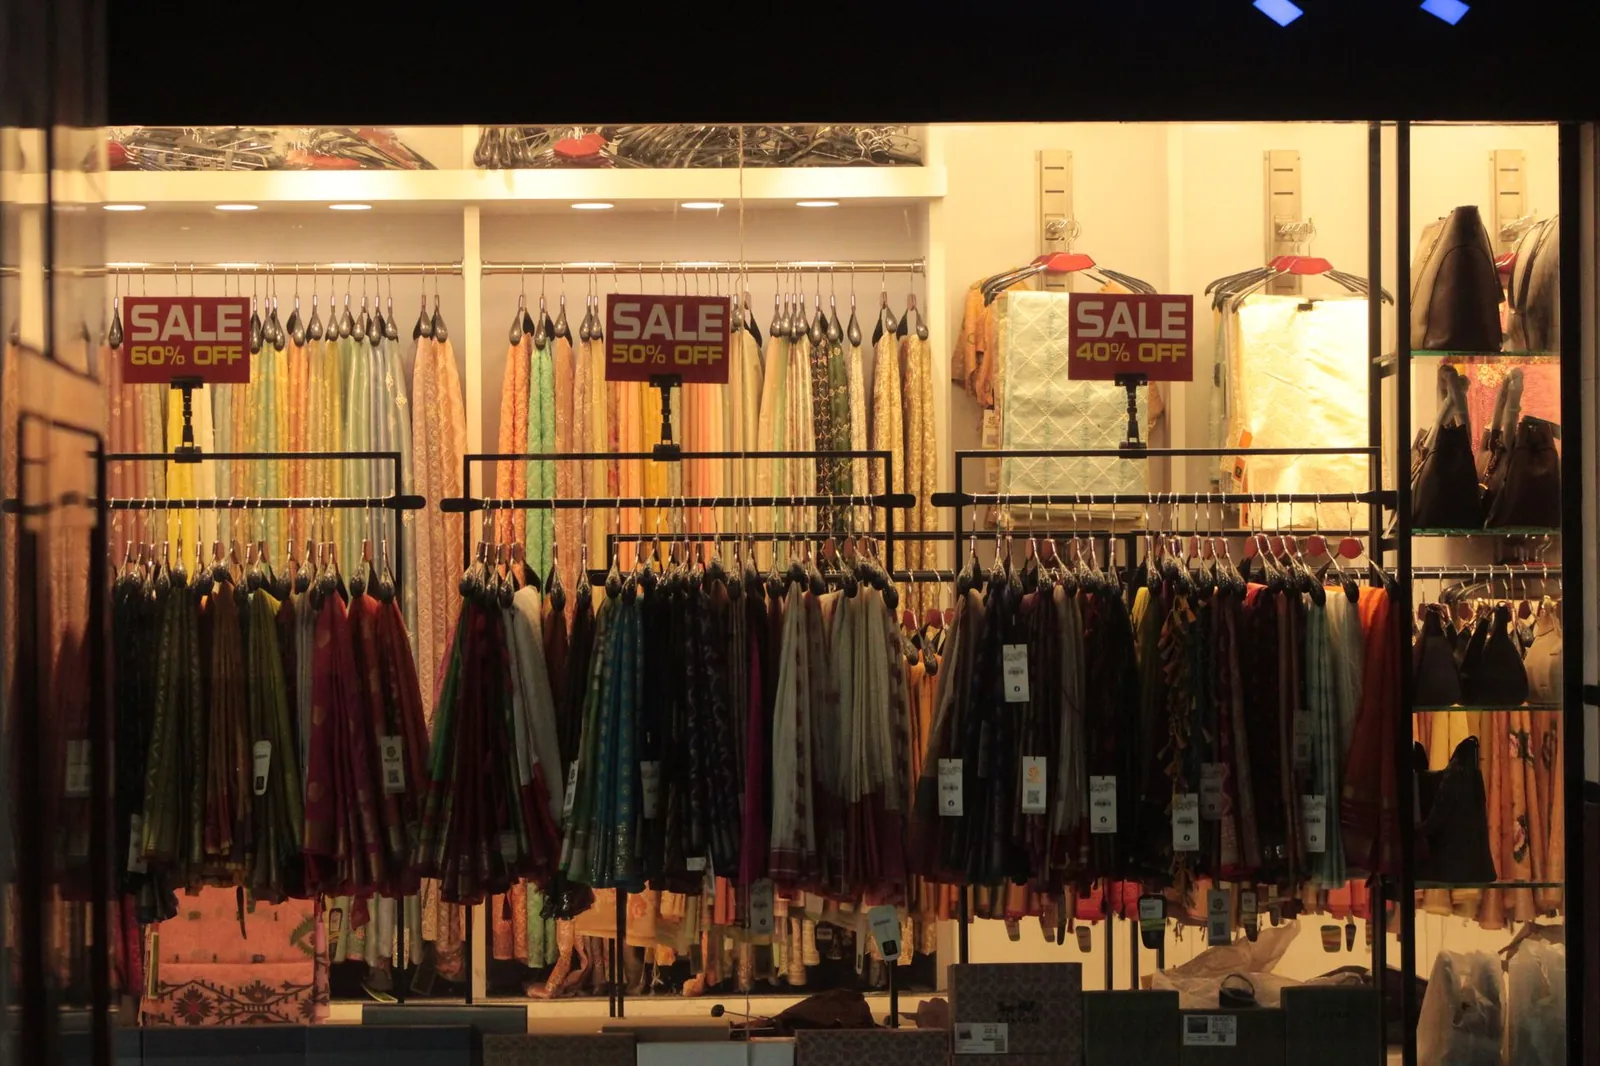
- The company expanded its retail footprint significantly, opening 139 new stores to reach a total count of 325.
- Operational efficiency improved as EBIDTA margins climbed from 13.7% to 14.9% during the year.
- Sales volume grew 47% YoY, while the Average Selling Price (ASP) improved from ₹297 to ₹327 per unit.
Financial Performance
V2 Retail demonstrated significant scale during FY26, with consolidated revenue reaching ₹3,067.1 Cr. This growth was underpinned by a strong performance in the fourth quarter, where revenue grew by 60% YoY. Profitability metrics saw a sharp uptick, with Net Profit after Tax (PAT) rising by 125% to ₹162.1 Cr.
The Men's wear segment remains the primary revenue driver, contributing 41% to the total top line. Improved operating leverage and a higher average selling price of ₹327 contributed to the expansion of EBIDTA margins to 14.9%, reflecting the company's ability to manage costs while scaling rapidly.
Management Outlook
Management expressed high confidence in the company's growth trajectory, focusing heavily on the 'neo middle class' emerging in Tier-II and Tier-III cities. To support this vision, V2 Retail added 139 new stores in a single fiscal year, bringing the total network to 325 stores. This aggressive expansion required a substantial increase in inventory levels, which led to Net Working Capital (NWC) days rising to 81 days from the previous 45 days.
The leadership remains committed to maintaining profitable growth by delivering high-quality, affordable fashion to value-conscious consumers in under-penetrated markets across India.
Sector Dynamics
The Indian retail sector, particularly the department store and value fashion segment, is witnessing a structural shift toward organized retail in semi-urban regions. V2 Retail's performance outpaced the broader sector, as evidenced by its 63% revenue growth compared to the sector average of approximately 37.8%. The company’s focus on Tier-II and Tier-III cities aligns with the increasing disposable income and fashion aspirations of consumers in these areas.
While inventory levels have risen, the strategy aims to capture market share in a competitive landscape where volume growth remains a critical metric for long-term sustainability.
What to Watch
- Normalization of Net Working Capital days, which increased to 81 days due to inventory stocking for new stores.
- Sustainability of the 14.9% EBIDTA margin as the company integrates 139 newly opened stores.
- Same-store sales growth (SSSG) trends in the newly penetrated Tier-II and Tier-III markets.
- The impact of rising Average Selling Prices (ASP) on overall sales volumes in the value-fashion segment.
“Management focused on profitable growth through high-quality, affordable fashion.”
| Share price | ₹236.05 |
|---|---|
| Market capitalisation | ₹8,607.27 Cr |
| Revenue (annual) | ₹1,884.50 Cr |
| Net profit (annual) | ₹72.03 Cr |
| Revenue (latest quarter) | ₹929.18 Cr+31.12% vs previous quarter |
| Net profit (latest quarter) | ₹102.07 Cr+492.35% vs previous quarter |
| P/E (TTM) | 57.23×Sector 75.1× |
| Promoter holding | 51.43%0.00% QoQ |
| FII holding | 2.62%Current quarter |
Reference market data from a third-party provider, as of the story. Not a valuation or a recommendation.
Exchange filing by V2 Retail Ltd announcing audited financial results for the quarter and year ended March 31, 2026. Market figures from a third-party data provider.