| P/E TTM | 28.07Sector PE 51.5 |
|---|---|
| Promoter Holding | 74.87%Zero Pledge |
| Market Cap | ₹1,152.68 CrGeneral Industrials |
| 1-Year Return | 14.07%Price Performance |
| Metric | Q2-27 | Q1-27 | Q2-26 |
|---|---|---|---|
| Revenue from Operations | 406 | 341 | 299 |
| Other Income | 3.6 | 4.3 | 4.3 |
| Total Income | 410 | 345 | 303 |
| Profit Before Tax | 22.0 | 6.7 | 6.4 |
| Net Profit | 16.2 | 5.1 | 4.8 |
| Operating Margin | 5.4% | 1.9% | 2.1% |
| Net Profit QoQ | +217.6% | ||
| Net Profit YoY | +237.5% | ||
| Adj. Profit QoQ | +666.7% | ||
| Adj. Profit YoY | +776.2% | ||
Key highlights
- Net profit jumped 237.5% year-on-year to ₹16.2 crore in Q2-27, compared to ₹4.8 crore in Q2-26
- Revenue from operations grew by 35.8% year-on-year, reaching ₹406 crore for the quarter
- Operating margins expanded to 5.4%, a substantial rise from 1.9% in the preceding June quarter
- Profit Before Tax (PBT) reached ₹22.0 crore, up from ₹6.4 crore in the same period last year
- Total income for the quarter stood at ₹410 crore, inclusive of ₹3.6 crore in other income
Sharp Profitability Growth and Revenue Momentum
Nelcast Ltd demonstrated strong operational momentum in the quarter ended September 30, 2026, as net profit surged to ₹16.2 crore. This represents a 217.6% increase on a sequential basis and a 237.5% jump compared to the year-ago period. Revenue from operations hit ₹406 crore, reflecting a 35.8% growth year-on-year.
The results highlight a recovery from the preceding quarter, where the company recorded a net profit of ₹5.1 crore on revenues of ₹341 crore. The performance was driven entirely by the iron castings segment, which remains the company's primary operational focus.
Operational Efficiencies and Margin Expansion
- Operating margins climbed to 5.4%, nearly triple the 1.9% recorded in Q1-27
- Cost of materials consumed for the standalone entity stood at ₹177.77 crore for the quarter
- Employee benefit expenses were managed at ₹22.88 crore, compared to ₹21.12 crore YoY
- Finance costs decreased to ₹7.44 crore from ₹8.42 crore in the corresponding quarter last year
- Total expenses for the quarter reached ₹387.58 crore, supporting the scaled-up production levels
Strategic Capex and Capacity Positioning
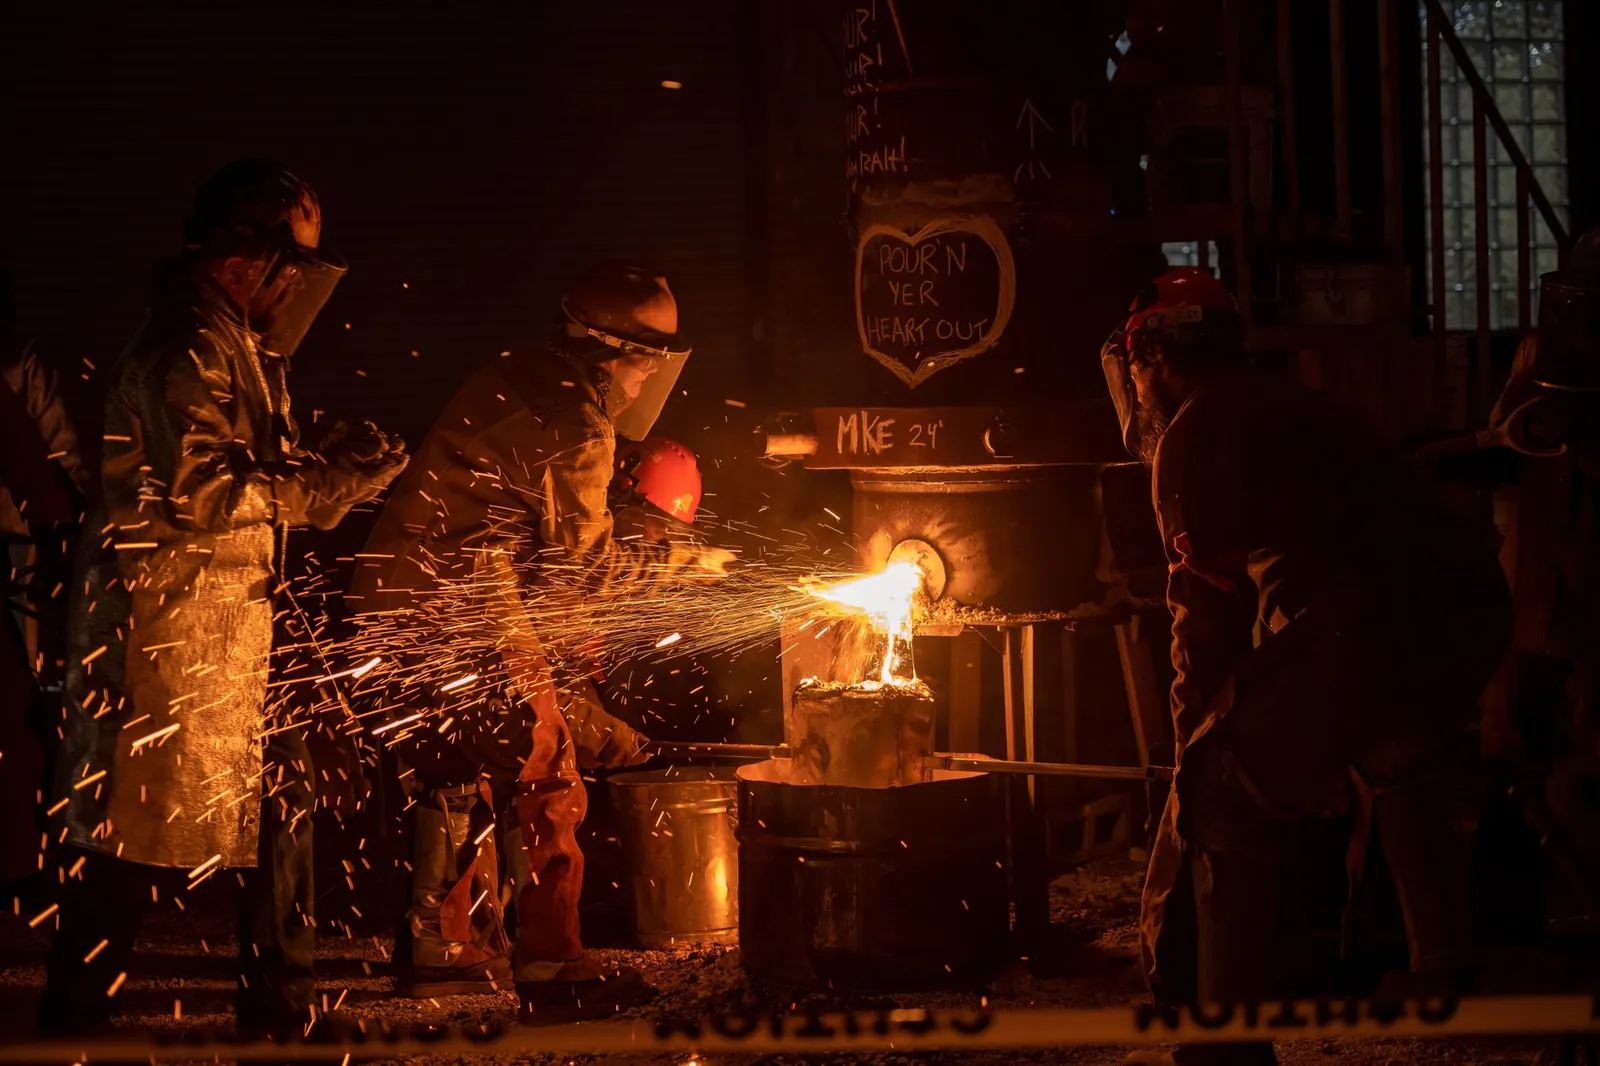
The company is positioning itself for future growth with a significant capital investment of ₹75.00 crore, approved by the board on October 5, 2026. This investment is directed toward establishing a new machining division at the Gudur facility in Andhra Pradesh, aimed at enhancing value-added services. Currently, Nelcast operates three manufacturing units located in Gudur, Pedapariya, and Ponneri, with an aggregate casting capacity of 160,000 MT per annum.
Management has previously guided for sales volumes exceeding 100,000 MT for FY27, supported by the ongoing ramp-up at the Pedapariya plant.
Consolidated View and Subsidiary Performance
The Company's subsidiary has not commenced its commercial operations yet, hence, the consolidated financial results of the Company are the same as the standalone financial results for the relevant period.
| Date | Announcement | Amount |
|---|---|---|
| 27 Jul 2026 | Q1 FY27 Unaudited Standalone Revenue from OperationsSource: sahi.com | ₹341.05 Cr |
| 09 Feb 2026 | Q3 FY26 Unaudited Standalone Revenue from OperationsSource: BSE filing | ₹329.62 Cr |
| 30 Oct 2025 | Q2 FY26 Unaudited Standalone Revenue from OperationsSource: BSE filing | ₹298.74 Cr |
| 31 Jul 2025 | Q1 FY26 Unaudited Standalone Revenue from OperationsSource: BSE filing | ₹331.86 Cr |
What to watch next
- Implementation of the new ₹75 crore machining division at the Gudur facility
- Achievement of the guided 100,000 MT sales volume target for the full financial year 2027
- Production ramp-up milestones at the Pedapariya plant throughout the second half of FY27
“The operations of the Company relate to only one primary segment viz., Iron Castings.”
| Share price | ₹132.49 |
|---|---|
| Market capitalisation | ₹1,152.68 Cr |
| Revenue (annual) | ₹1,328.40 Cr |
| Net profit (annual) | ₹48.43 Cr |
| Revenue (latest quarter) | ₹341.05 Cr-7.37% vs previous quarter |
| Net profit (latest quarter) | ₹5.14 Cr-66.36% vs previous quarter |
| P/E (TTM) | 28.07×Sector 51.5× |
| Promoter holding | 74.87%0.00% QoQ |
| FII holding | 0.02%Current quarter |
Reference market data from a third-party provider, as of the story. Not a valuation or a recommendation.
Financial results for the quarter and half-year ended September 30, 2026, as filed with the BSE by Nelcast Ltd. Market figures from a third-party data provider.